从 Prometheus 查询 Metrics 监控指标
准备条件
本文演示在如何 Kubernetes 环境下部署的 Prometheus 并实现对 Dubbo 集群的监控数据统计与查询,你需要完成或具备以下内容:
- 本地或远端 Kubernetes 集群
- Kubernetes 集群安装 Prometheus
- 部署示例应用
- 使用 Prometheus dashboard 查询数据指标
部署与安装 Prometheus
Kubernetes 环境安装
使用以下 Dubbo 社区准备好的 Prometheus 配置文件,可以快速的将 Prometheus 启动起来:
$ kubectl apply -f dubbo-stack/prometheus.yaml
验证 Prometheus 已经正确部署
$ kubectl get svc prometheus -n dubbo-system
配置 Prometheus
Dubbo 的每个实例都会暴露一个 http 端口用于 Metrics 采集,Prometheus 通过 scraping 每个实例的 http 接口来采集统计数据。具体的 scraping 路径可以通过 Prometheus 配置文件进行调整,该文件控制 scraping 实例的端口、路径、TLS 设置等。
本示例基于 prometheus.io 注解实现了 scraping target 地址的自动发现,具体注解配置可参见示例中的 Deployment 资源定义。在此模式下,Dubbo 实例默认提供的 Prometheus Metrics 采集路径是:20888/management/prometheus。
用户还可以自定义安装 Prometheus。此时,需要正确配置 Prometheus scraping 的目标动态地址路径,我们推荐配合 Dubbo Admin 作为 Prometheus 地址发现的目标地址,具体请参见 【Dubbo 生态集成】-【Prometheus 安装】。
部署示例项目
接下来,部署示例项目以模拟产生调用数据。完整的示例地址请在此查看 dubbo-samples-metrics-spring-boot
1. 下载示例源码
$ git clone https://github.com/apache/dubbo-samples.git
2. 部署示例
$ cd dubbo-samples/4-governance/dubbo-samples-metrics-spring-boot/deploy/k8s
$ kubectl apply -f ./
3. 查看示例启动成功
$ kubectl get pods -n dubbo-demo
Dubbo 服务开始模拟正常运行,接下来可以通过 Prometheus 查看统计数据了。
查询 Prometheus
获得 Prometheus dashboard 访问地址
$ kubectl port-forward service/prometheus ${port}:${port}
接下来,执行 Prometheus 查询命令。可以在此确认 Dubbo 支持的 Metrics 指标。
1. 在 “Expression” 一览,输入 dubbo_requests_total,返回以下结果
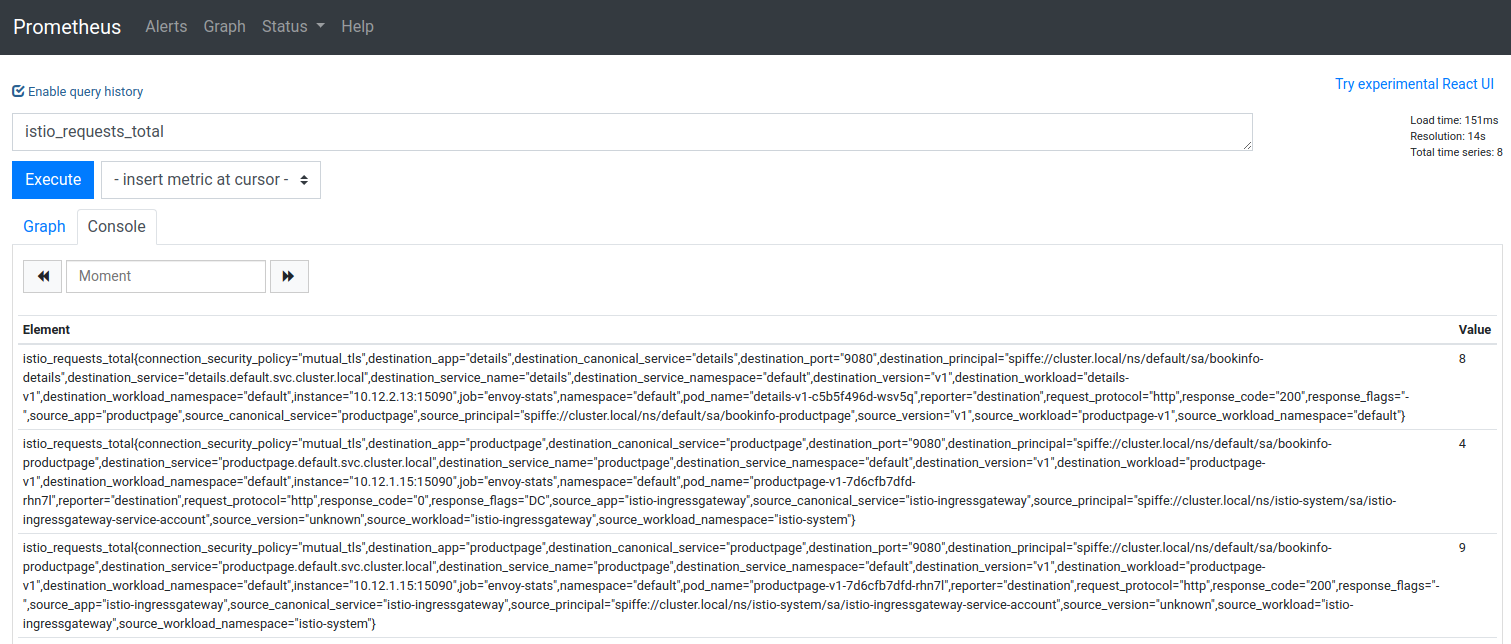
2. 在 “Expression” 一览,输入 dubbo_requests_total,返回以下结果